
Introduction
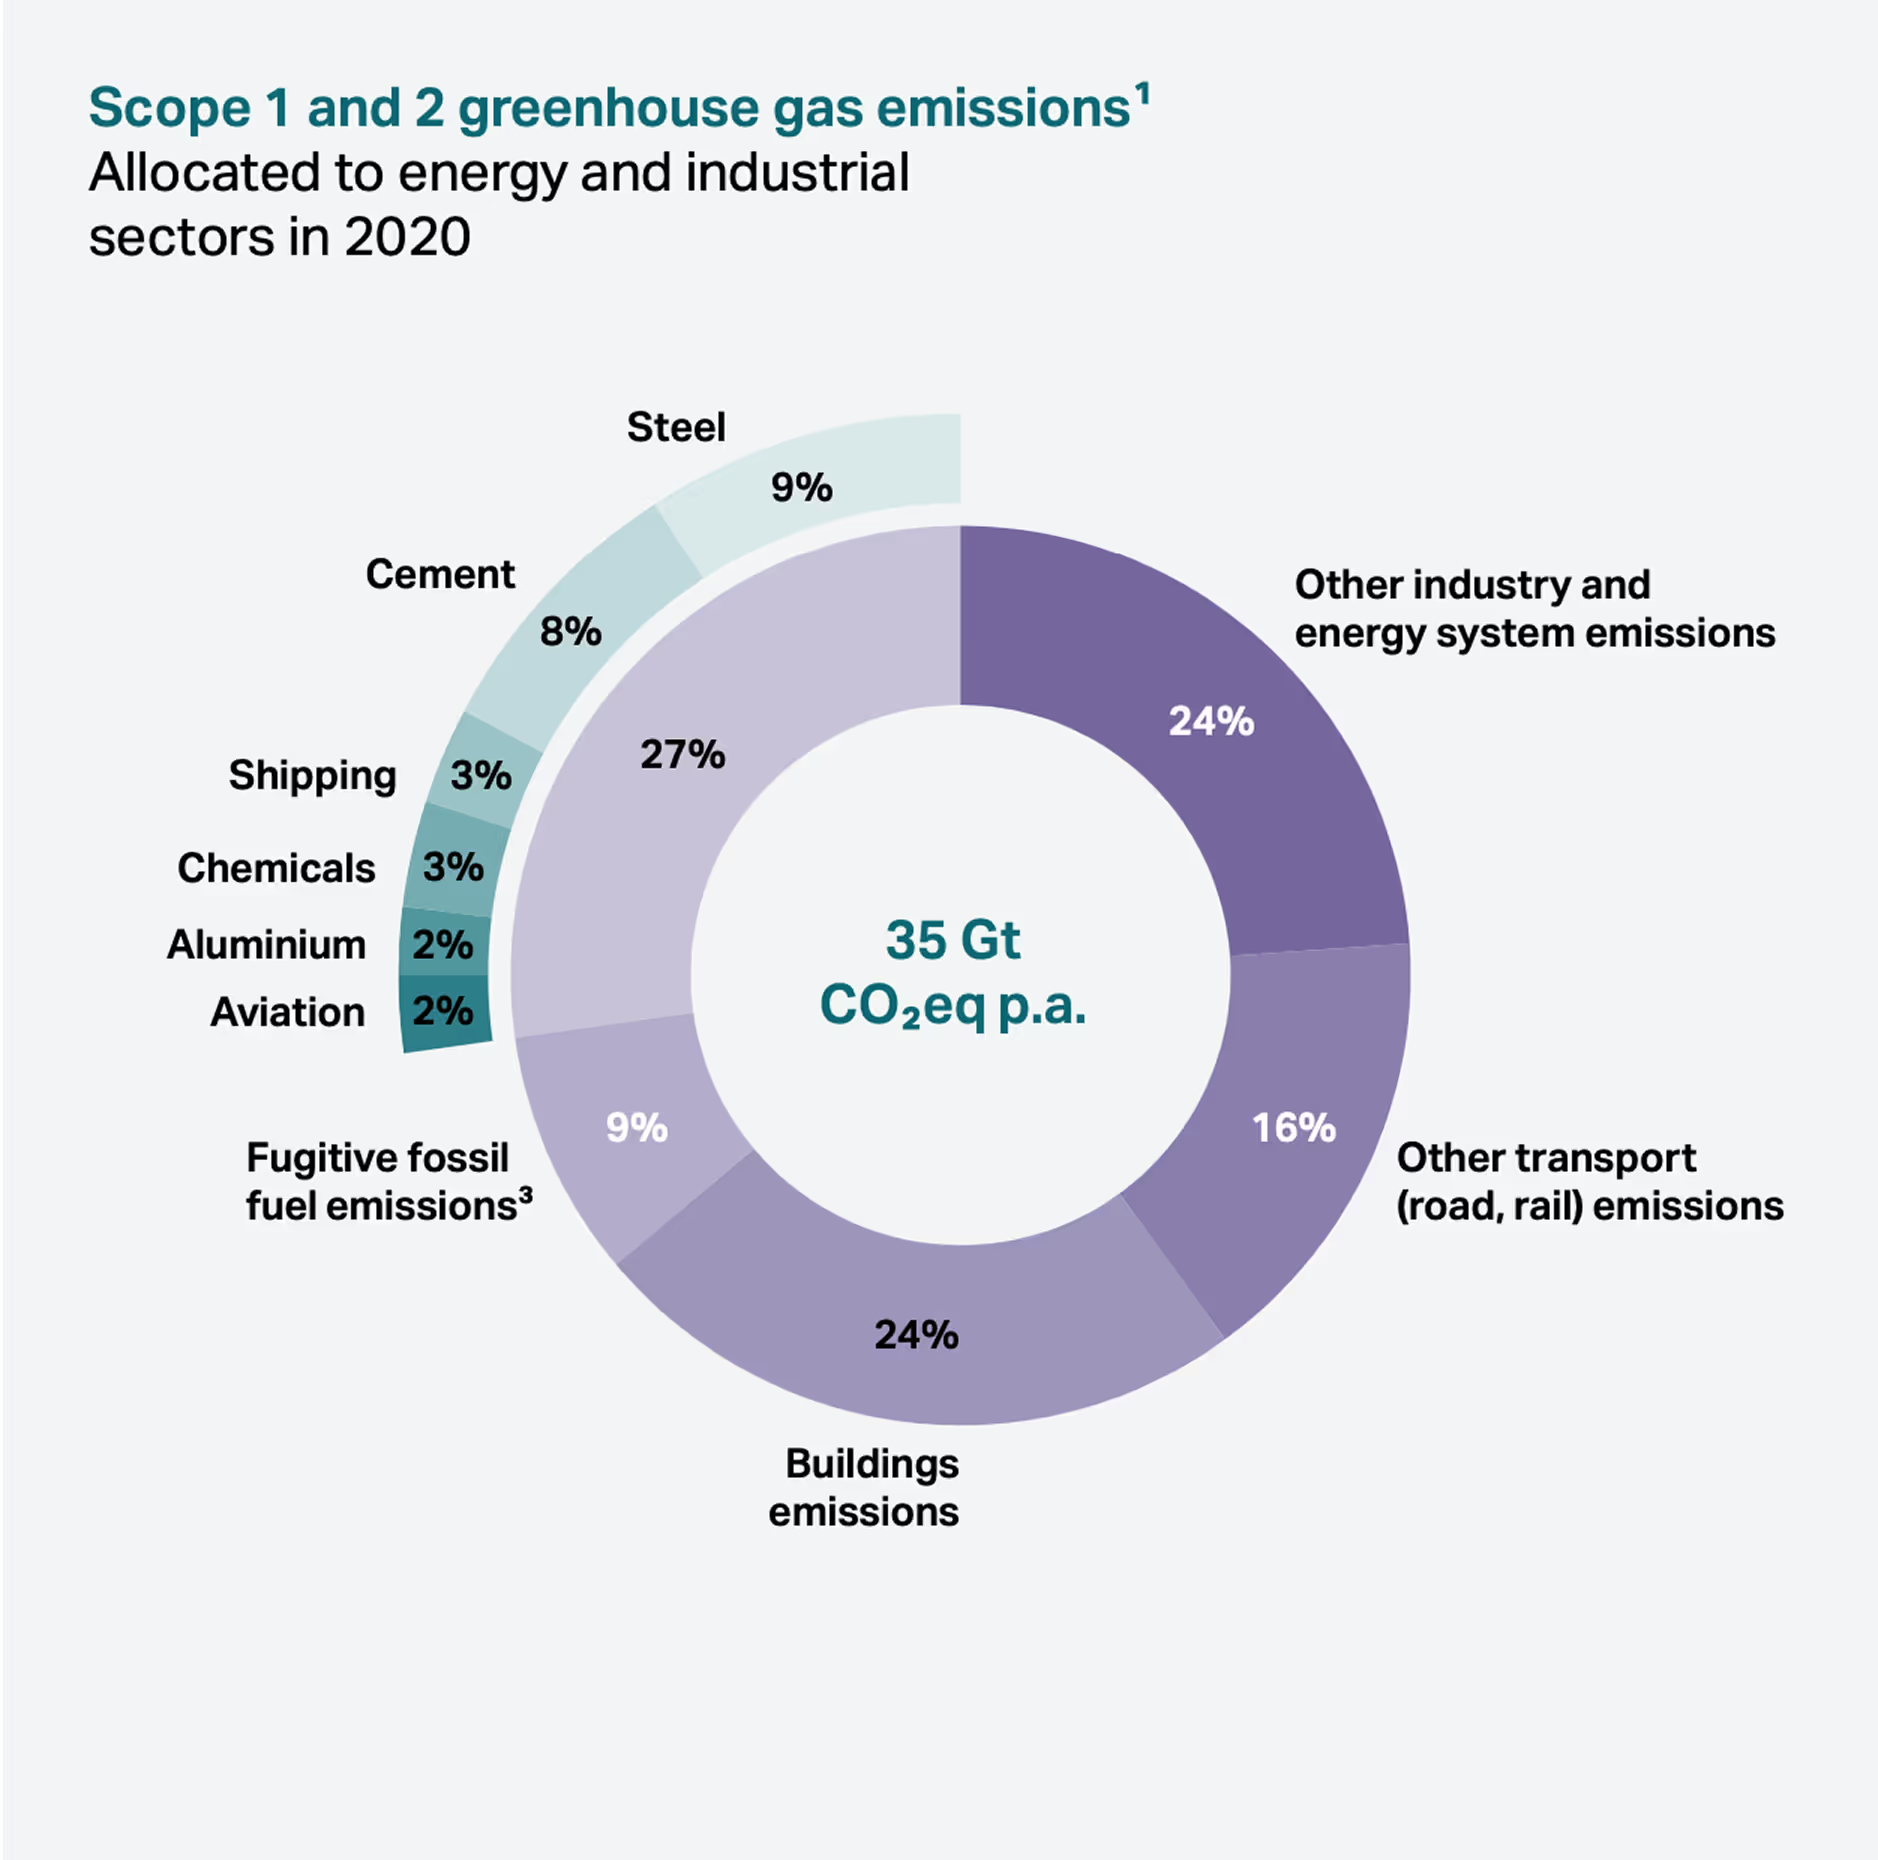
There is an urgent need to transform and decarbonise heavy industry and transport sectors, namely aviation, maritime, aluminium, cement, chemicals, and steel, given that they account for nearly 30% of global emissions.
Click below to learn more about how demand-side
government policies are instrumental to industrial decarbonisation and how they can complement other policies.
There is an urgent need to transform heavy industry and transport quickly to win the war against climate breakdown.
- Heavy industry and transportsectors are responsible for nearly 30% of global CO₂e emissions² and make up a significant portion of scope 3 emissions for other sectors.
- In a world where scope 3 emissions are under scrutiny and need to be addressed, hard-to-abate sectors are facing increasing pressure to decarbonise.
Show footnotesHide footnotes
1: global scope 1 and 2 emissions shown with GWP 100 used for non-CO2 emissions
2: excludes agriculture, forestry and land use emissions
3: Fugitive emissions are greenhouse gas emissions that arise from leaks and other irregular releases, usually associated with industry and fossil fuel extraction.
Sources: IEA (2021), GHG Emissions from Energy, Mission Possible Partnership (MPP) (2020), European Environment Agency
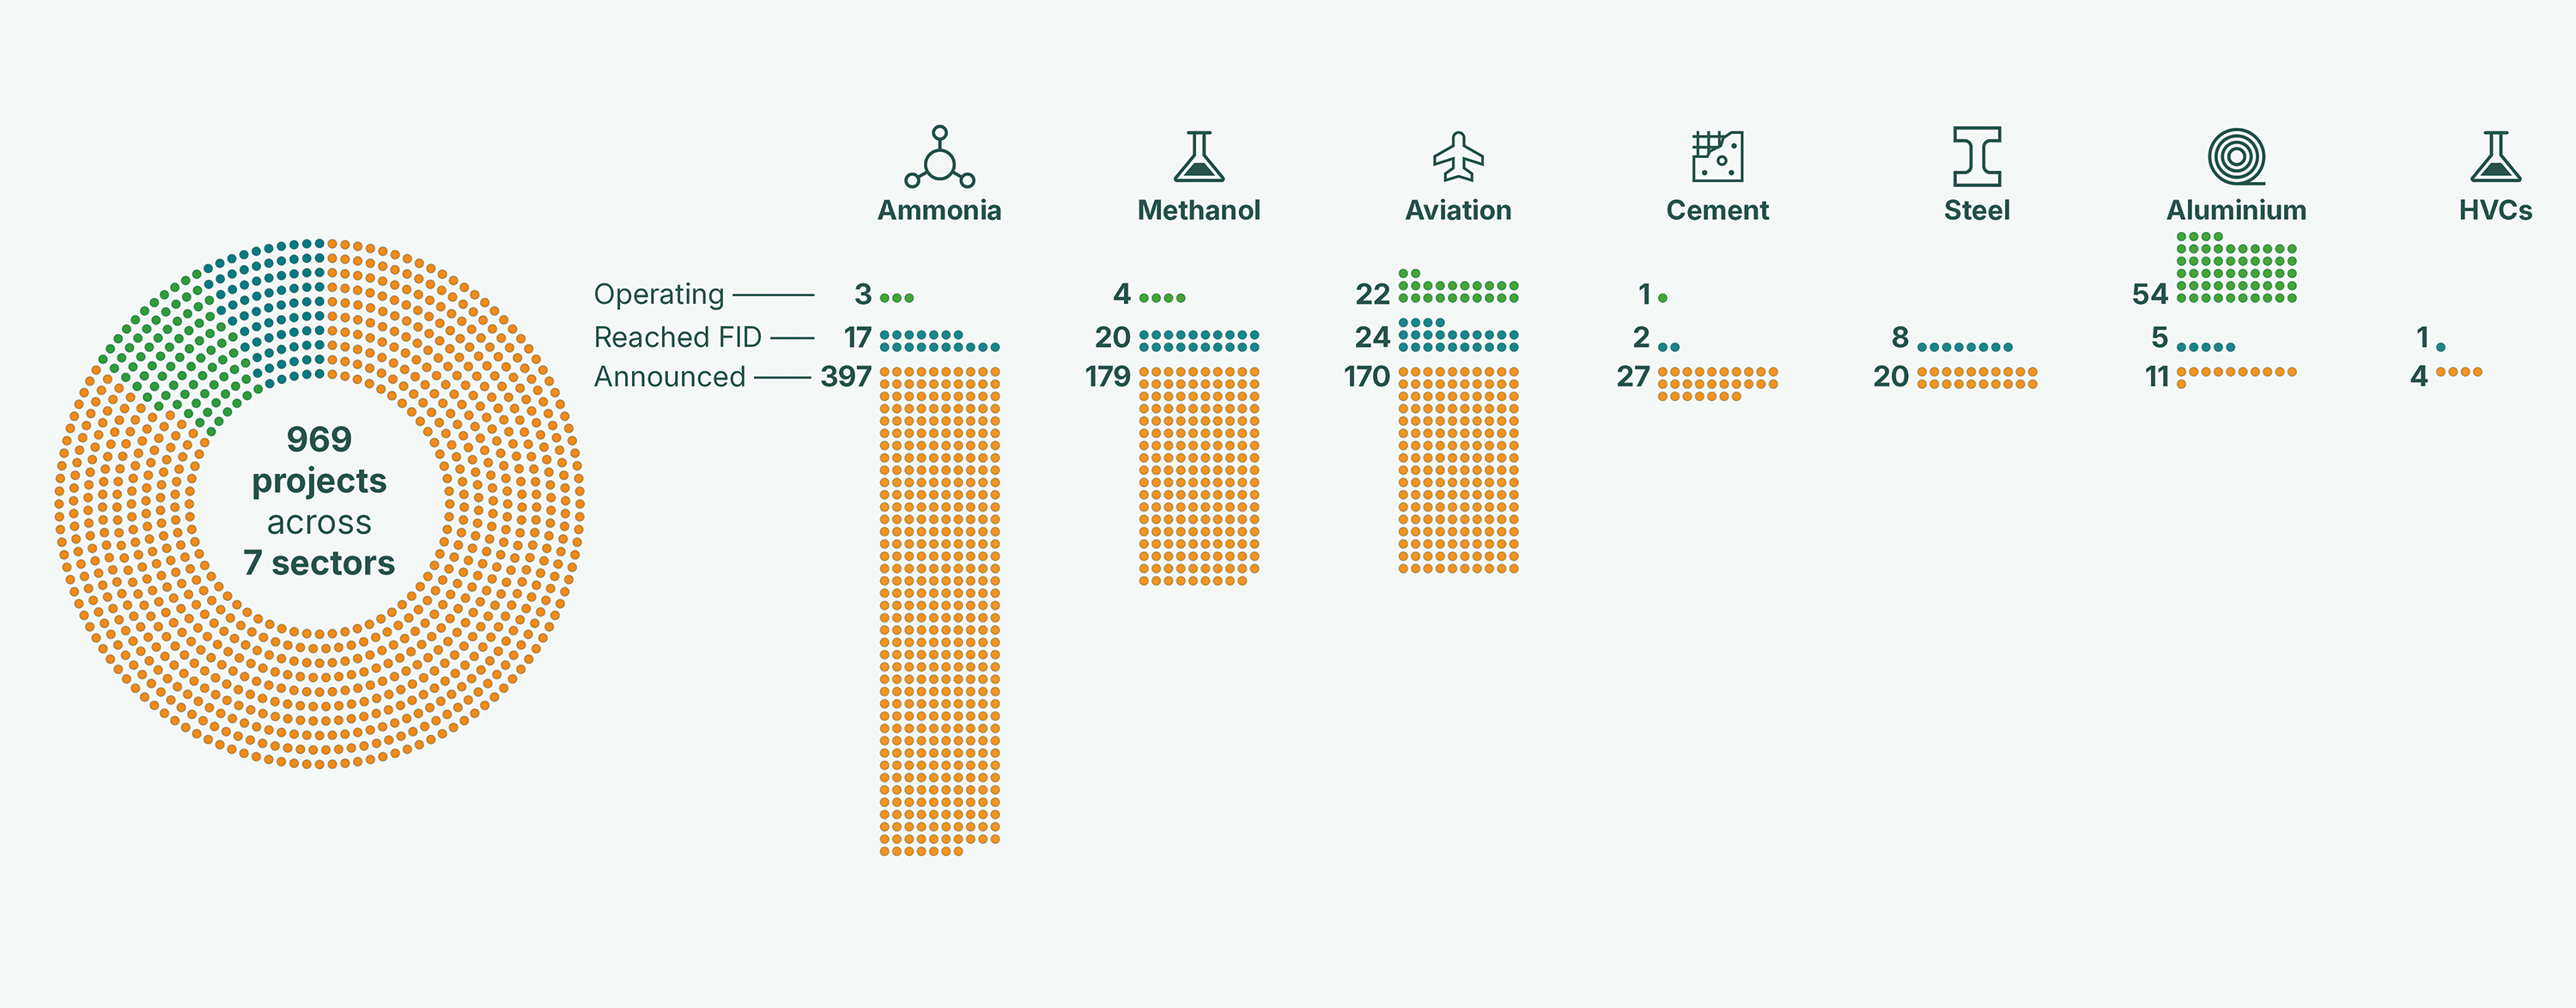
Transformation is happening but progress is vastly insufficient. Although over 800 commercial scale deep decarbonisation projects have been announced, only 161 have passed FID.
Show footnotesHide footnotes
Source: MPP Global Project Tracker (June 2026)
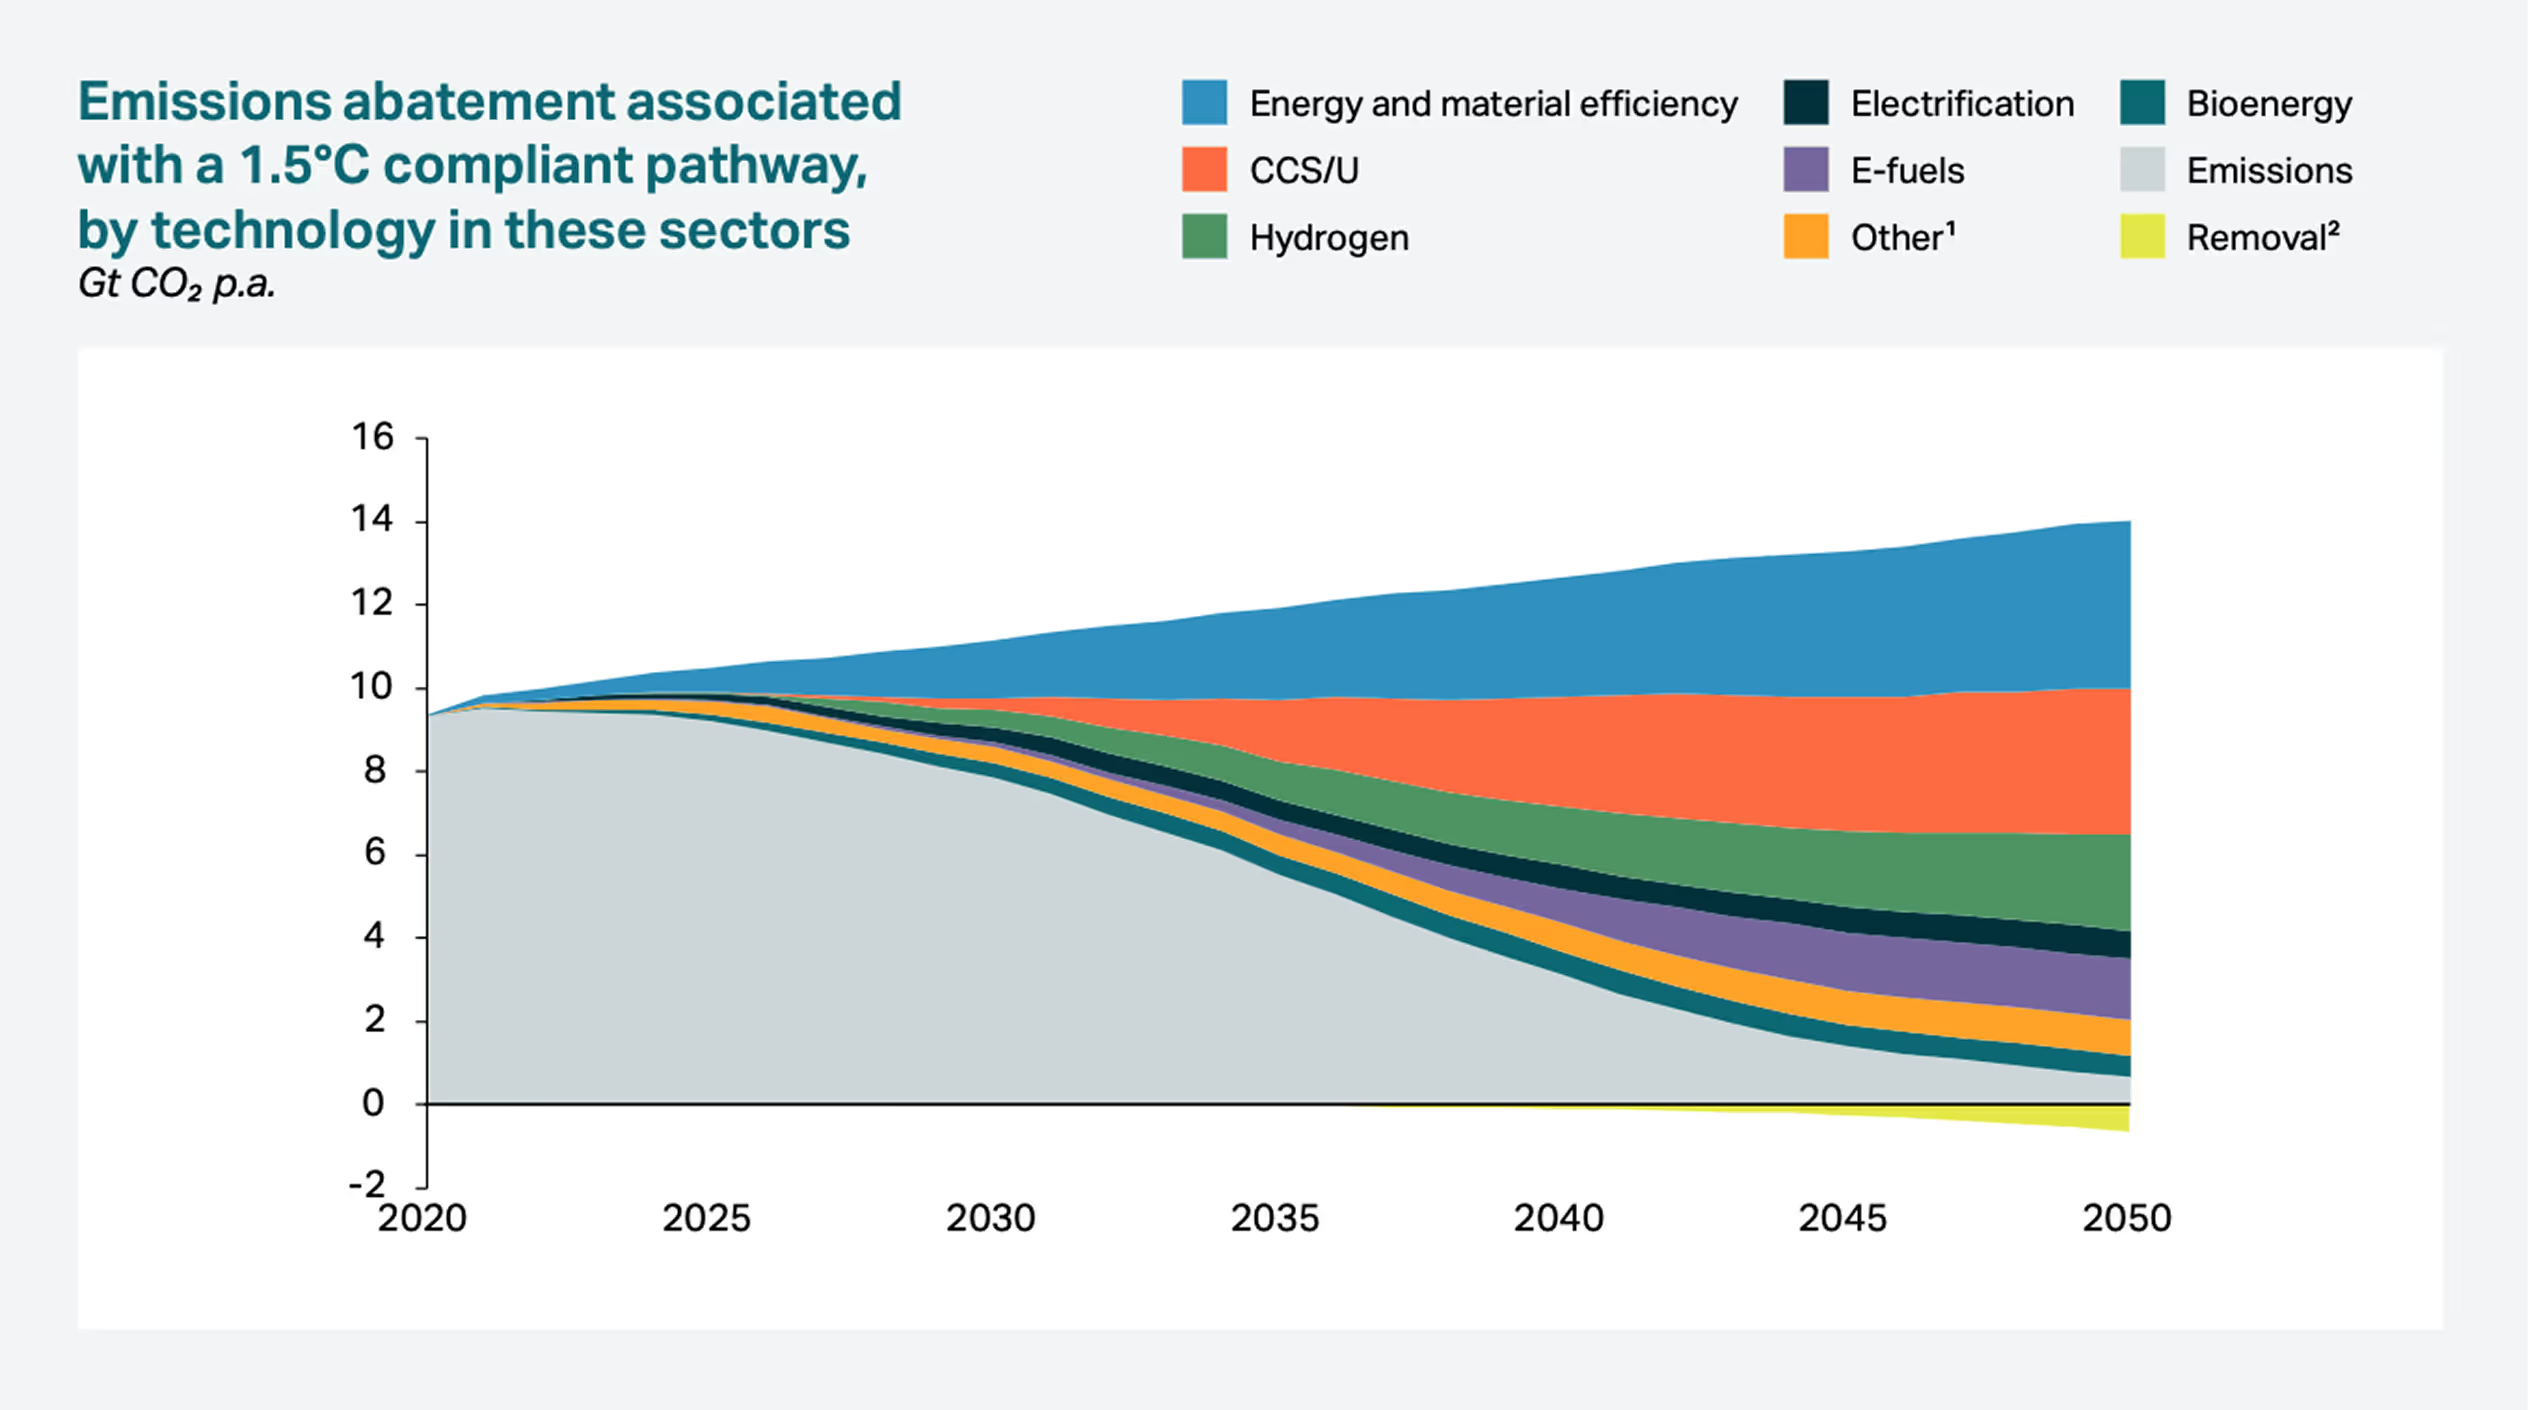
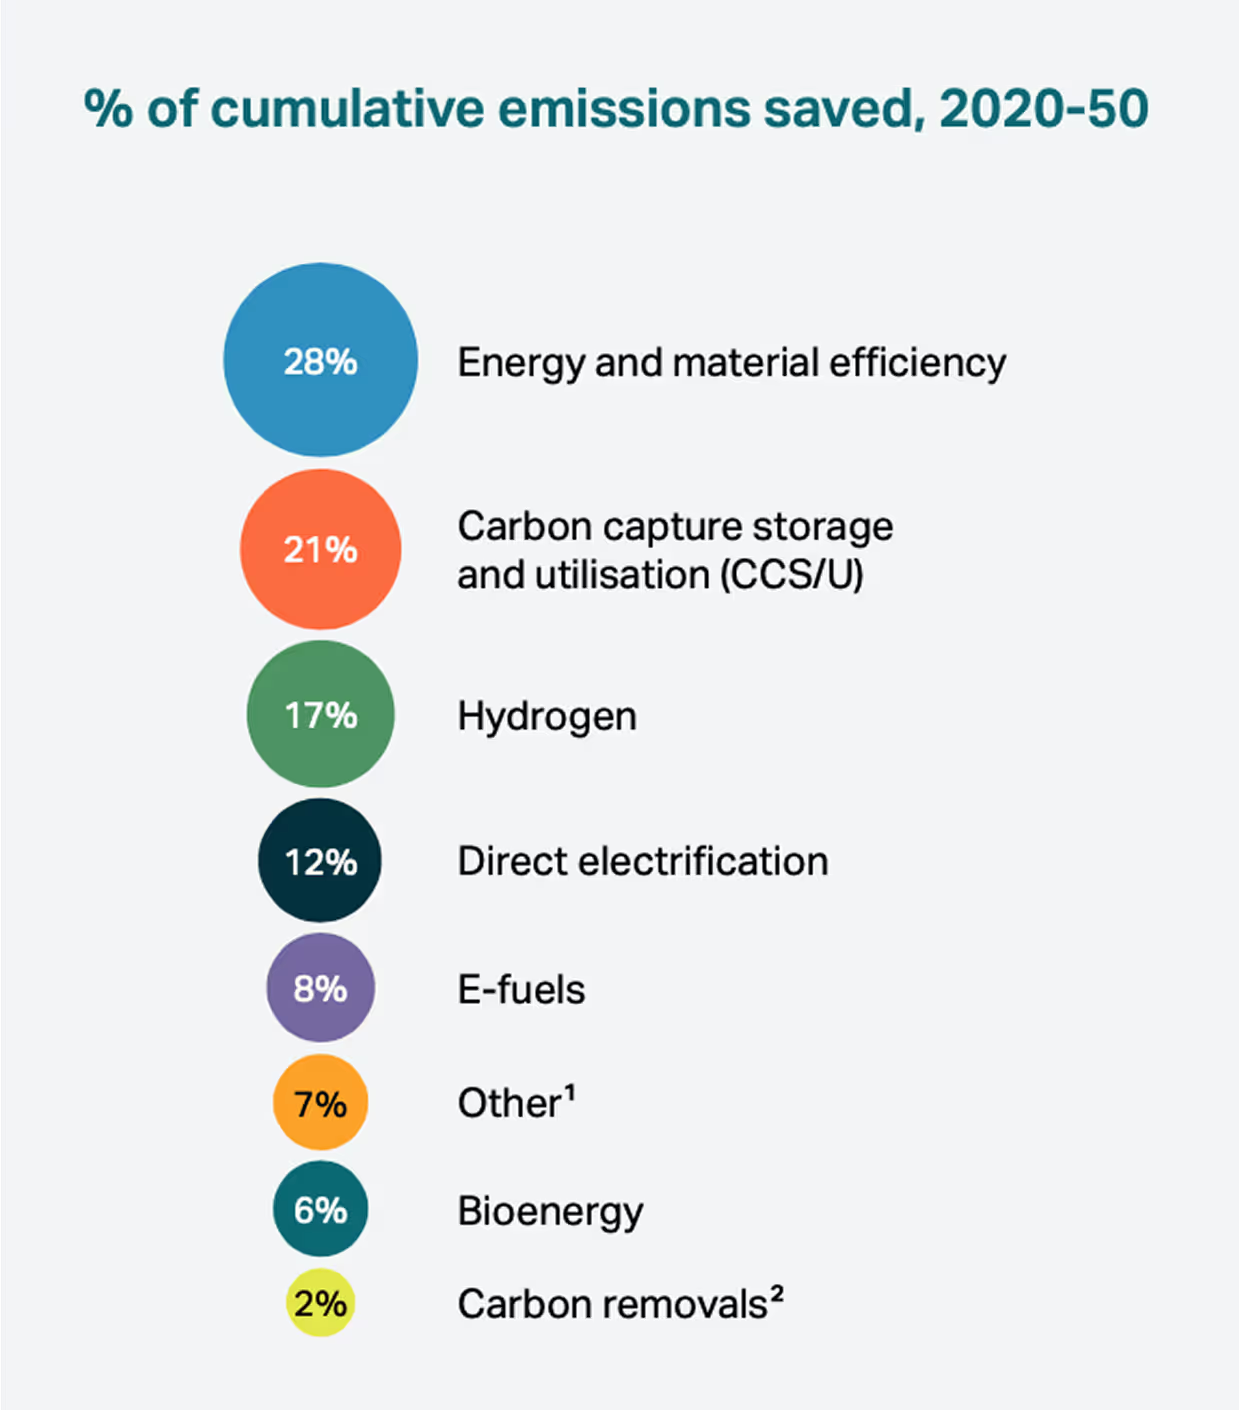
In addition, other decarbonisation levers, such as increased energy and material efficiency, including greater circularity, will also be needed.
Show footnotesHide footnotes
Notes: emissions calculated for hard-to-abate sectors in scope (i.e. aluminium, concrete, steel, maritime, aviation and chemicals)
1: other includes transitional technologies, fuel switching and sector specific technologies (e.g. inert anodes in aluminium)
2: carbon dioxide removals are used in roadmaps to reach net zero by 2050 i.e. counter-balancing residual emissions in 2050. In the figure shown, a potential ramp-up of these carbon dioxide removals are included
Source: MPP analysis, based on MPP’s sector transition strategies
First-of-a-kind projects have benefited from first-mover advantages, but these have faded for the next wave of projects: a framework of levers is needed to unlock supply.
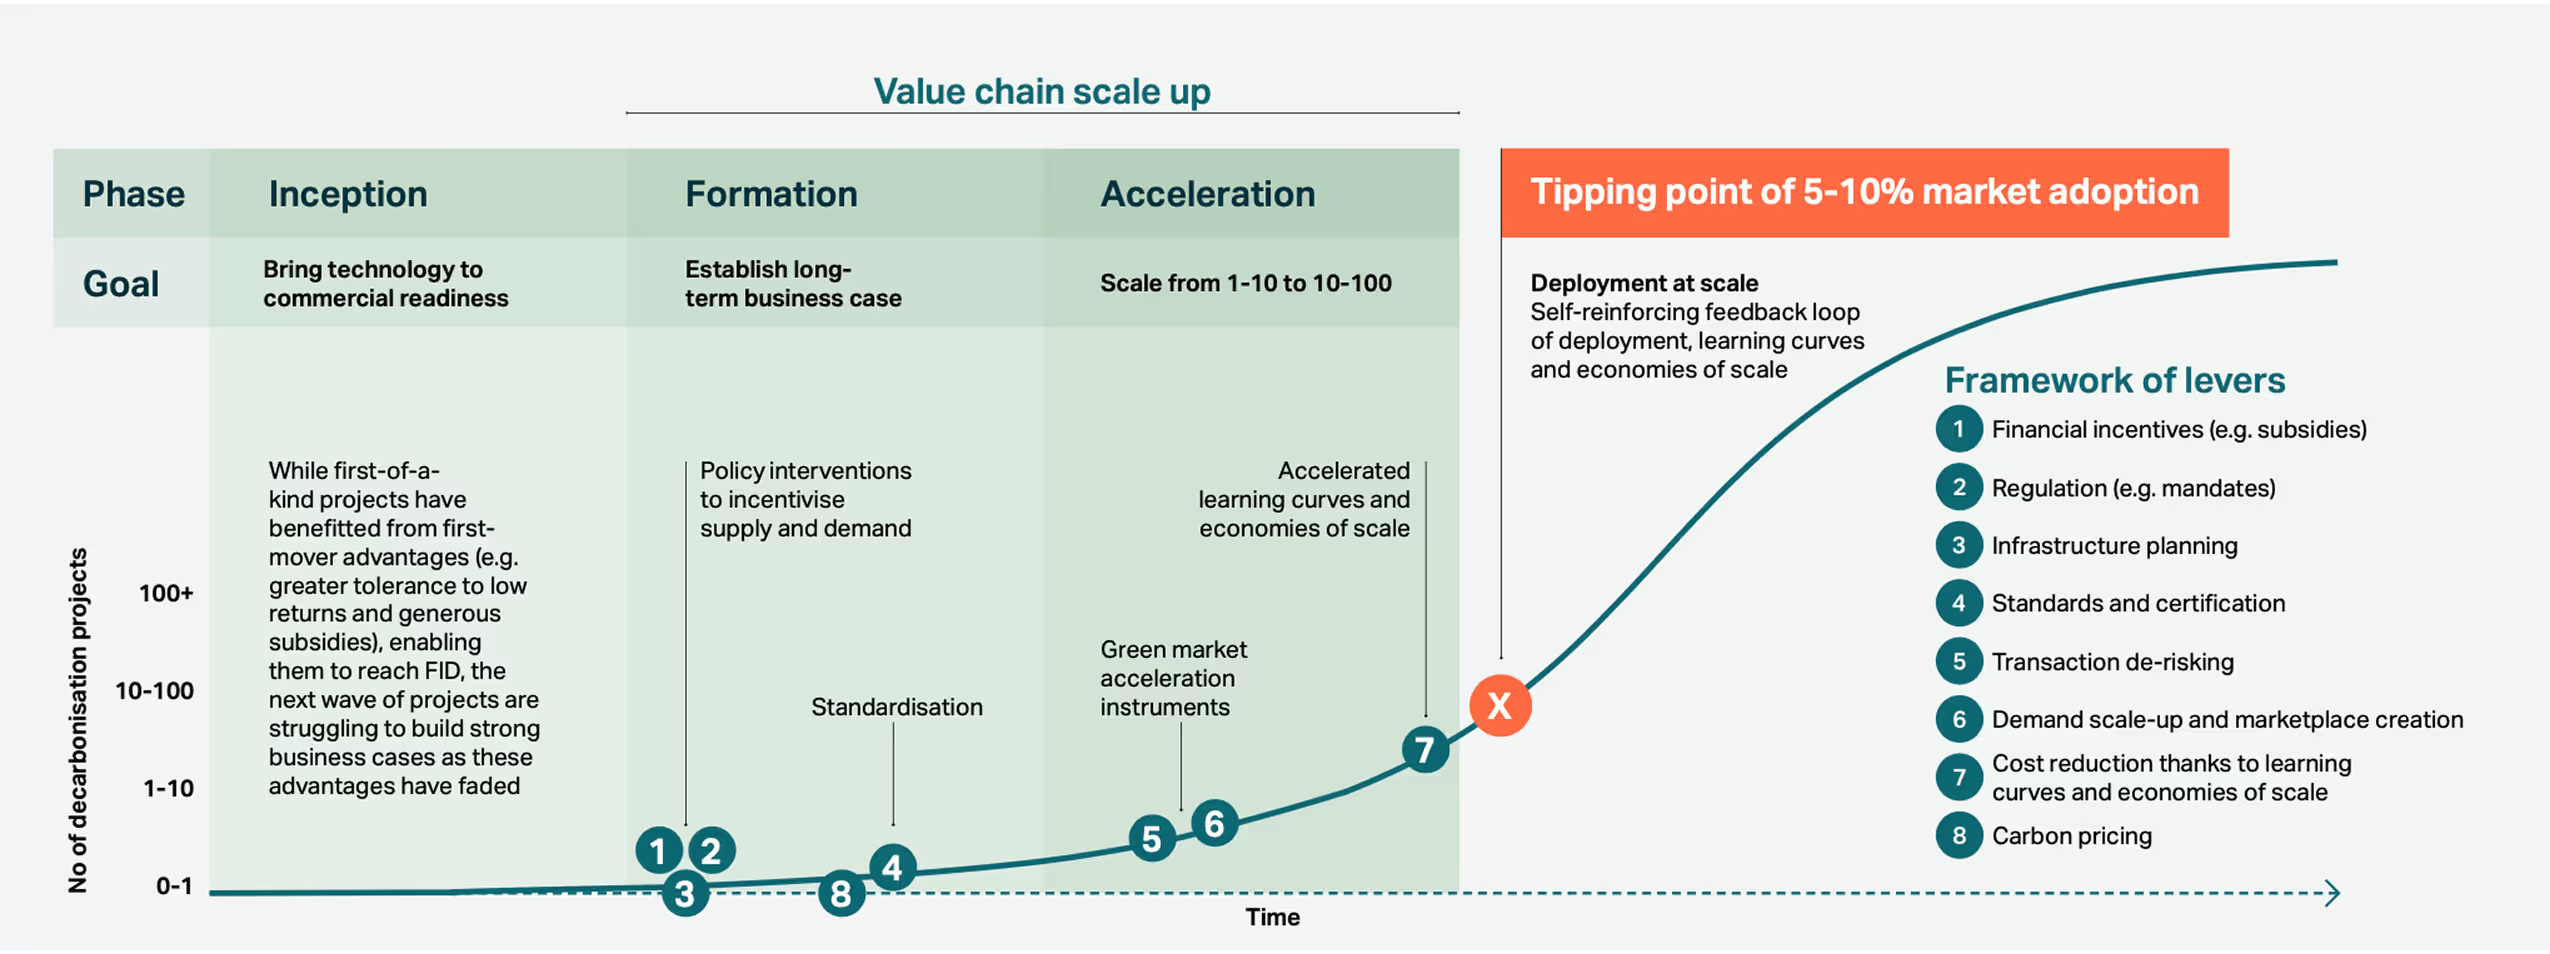
Show footnotesHide footnotes
Source: MPP analysis
A comprehensive policy framework is required to drive heavy industry and transport decarbonisation: green demand stimulation is a critical but underleveraged dimension
Today, many initiatives and policies have been geared towards research and development and supply stimulation. Critically, green demand stimulation needs to be addressed to stay in line with the desired growth in low-carbon production.
Research and
Development
- Funding early-stage trials and demonstration projects to advance new technologies towards commercial deployments
- Many demonstration projects are underway for key technologies.
Critical
enablers
- Robust certifications and standards for low and near-zero emission products
- Scaling up underpinning energy infrastructure (e.g. clean electricity supply and hydrogen transportation)
- Certifications are a work in progress¹
- Strategic infrastructure planning ongoing in many geographies, but its construction is lagging behind.
Demand
stimulation
- Creating differentiated markets for green products (e.g. via mandatory measures and green public procurement)
- Providing financial incentives to use green fuels and materials (e.g. via carbon taxes and subsidies)
- Promising examples across multiple geographies, but not widely adopted yet.
Supply
stimulation
- Providing financial support and low interest loans to scale up supply capacity
- Expediting planning and permitting for energy supply and green industrial projects
- Prioritising use of sustainable bio-energy feedstocks for heavy industry and transport
- Supply-side packages developed in many advanced and emerging economies.
Show footnotesHide footnotes
1: see the ITA Standards Map for more details
The policies in this playbook must be underpinned by a foundation of robust standards consisting of accounting methodologies, definitions and certification
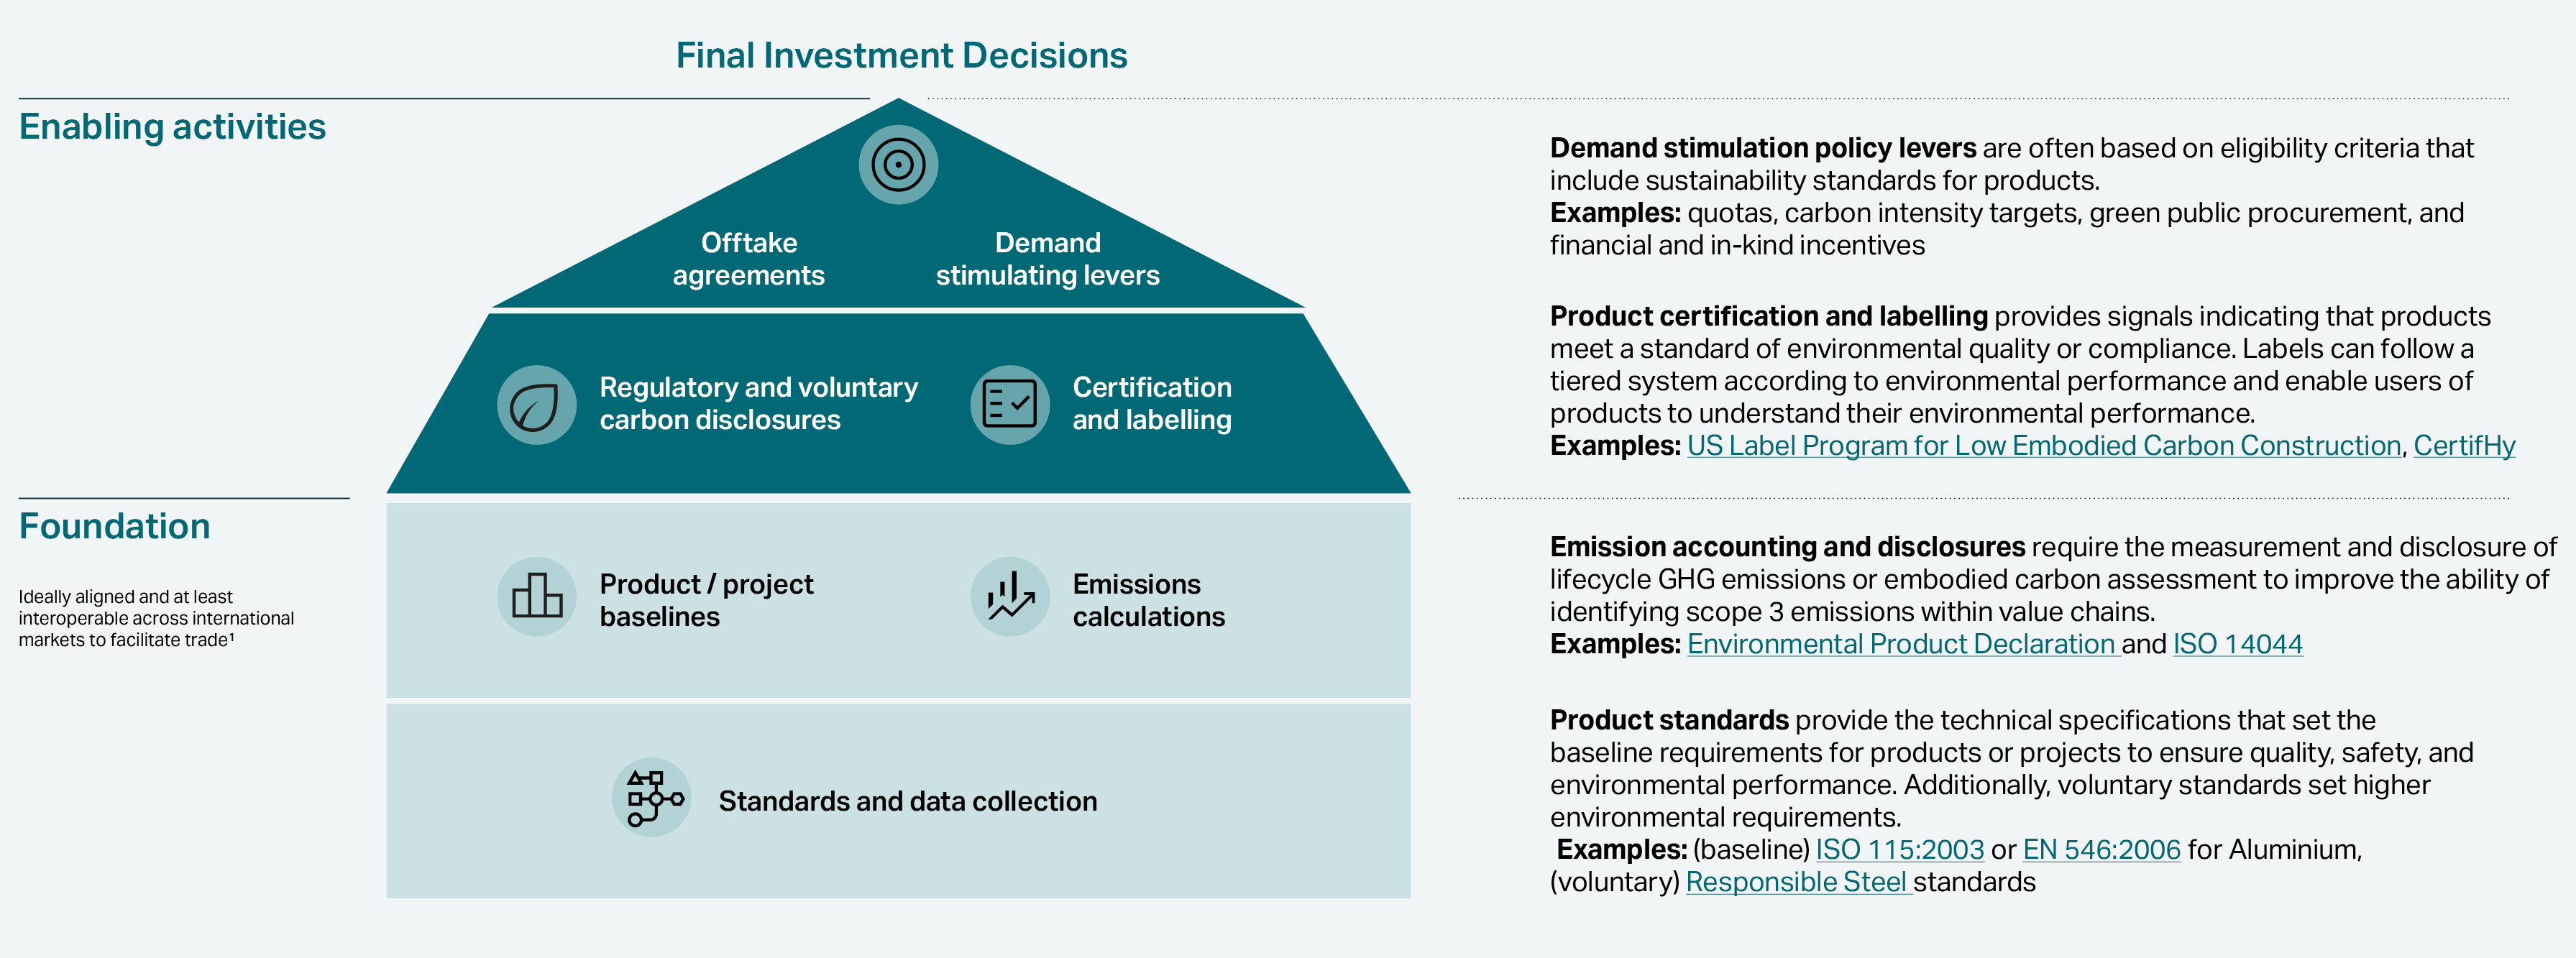
Show footnotesHide footnotes
For more details on standards, see Mission Possible Partnership (MPP)’s Standards Map. Figure adapted from CEM Industrial Deep Decarbonisation Initiative.
1: IRENA (2024): Global trade in green hydrogen derivatives gives examples of how certification schemes for products like green hydrogen and its derivatives can be made interoperable.
Sources: Agora Industry (2024): Creating markets for climate-friendly basic materials. Potentials and policy options, MPP (2022): Low Carbon Concrete and Construction: A Review of Green Public Procurement Programmes
Combinations of policies, e.g. carbon pricing and/or complementary subsidies and regulations, have proven to be effective emission reduction strategies
- Based on a systematic study of climate policies from the past 20 years, using a mix of policies can lead to greater emissions reductions.
- All policy instruments studied, except financing mechanisms/subsidies, had a larger effect on emissions reductions when combined with other policies, than when implemented alone.
- Furthermore, a larger impact was achieved when combining non-pricing and pricing mechanisms (namely taxation or reduced fossil fuel subsidies).
- Using a mix of policies has proven to be successful in other sectors, e.g. with zero emission vehicle adoption in California, US.
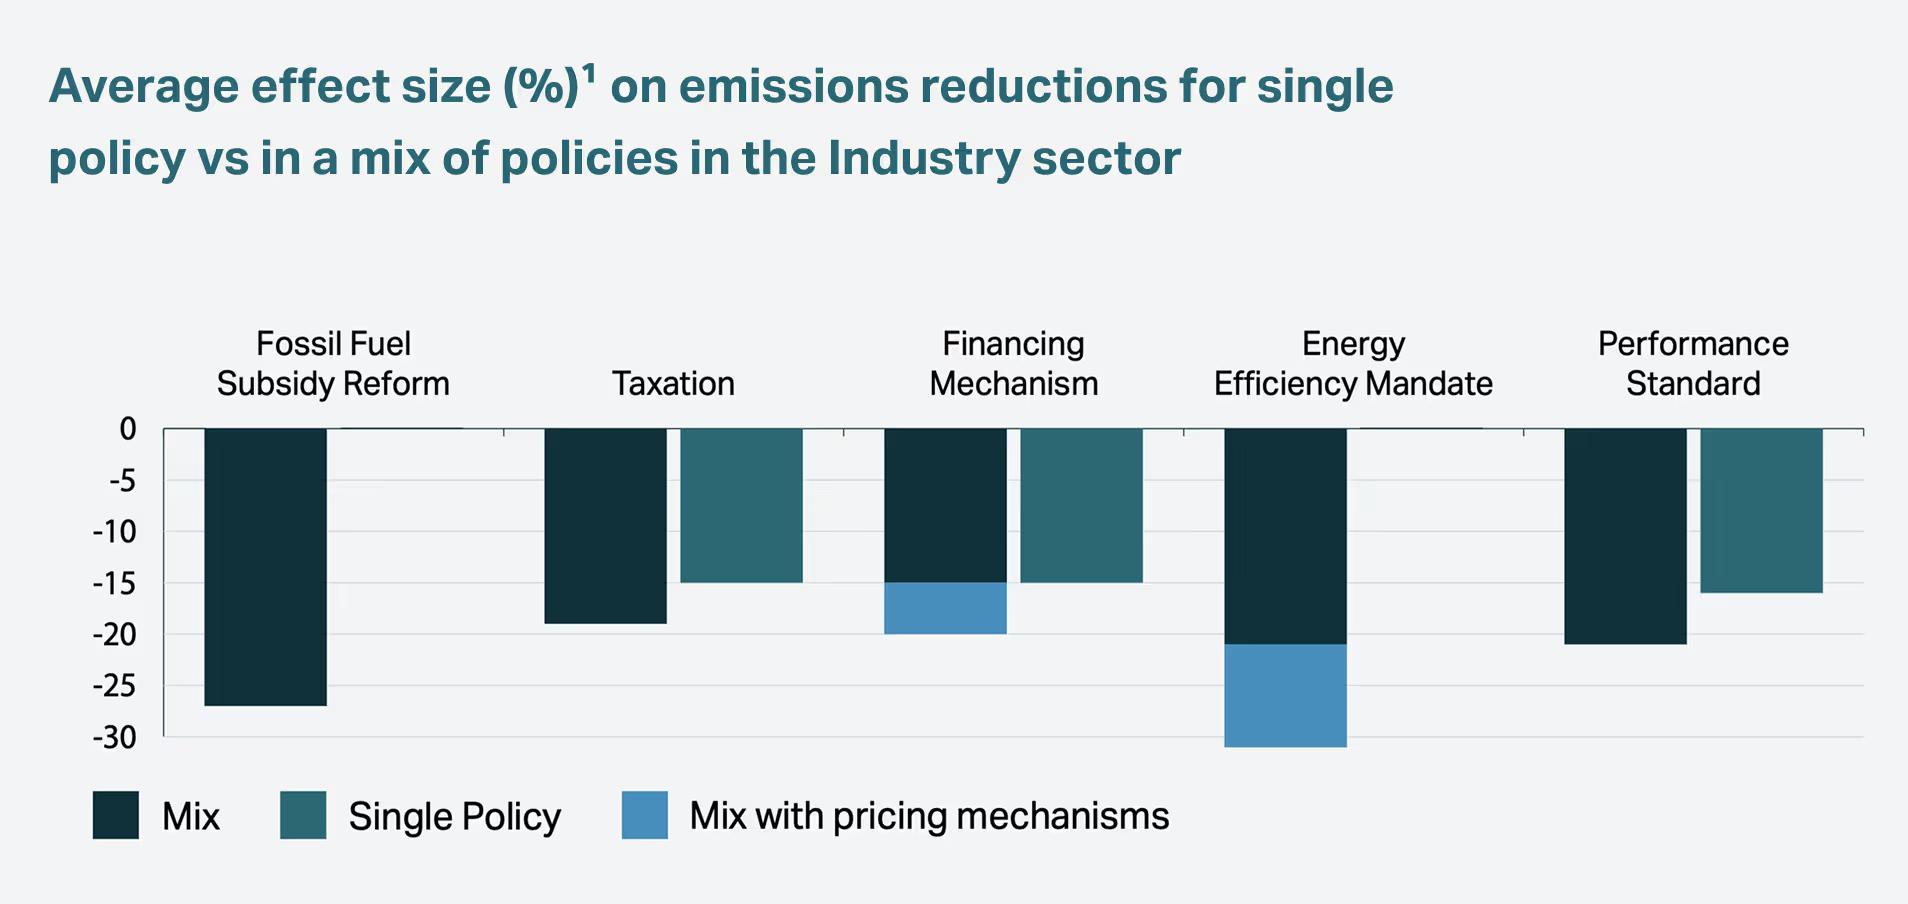
Case study: Zero Emission Vehicles (ZEV) Adoption in California
- In 1990, California pioneered a mandate for ZEVs, requiring manufacturers to annually surrender tradable credits gained by selling ZEVs. Manufacturers who generate more credits than needed can sell them to those with a deficit. The overall percentage of ZEV (and in practice hybrids) out of total vehicles sold progressively increased from 4.5% in 2018 to 22% in 2025. Since the mandated share of credits started low, this had only a small knock-on cost impact on conventional vehicles.
- Accompanying mandates were state funded rebates, offered to subsidise EV purchases. Under the California Clean Vehicle Rebate Project, rebates range from $1,000 to $7,500 for buying or leasing eligible ZEV. Adoption was the highest in Los Angeles and Santa Clara counties in 2015, where many rebates were issued. In 2015-2016, $128m in rebate funds were distributed in the state.
- The mandate, coupled with demand-side subsidies, enabled early movers to enter the market and create an additional revenue stream. Between 2012-2017, almost all ZEV credits traded were generated by Tesla and Nissan. Analysis suggests the programme contributed to Tesla's survival until it became structurally profitable from 2020. By then, Tesla had become the world's most valuable car manufacturer, subsequently overtaken by Chinese manufacturer BYD (similar policies were adopted under China's New Energy Vehicle programme).
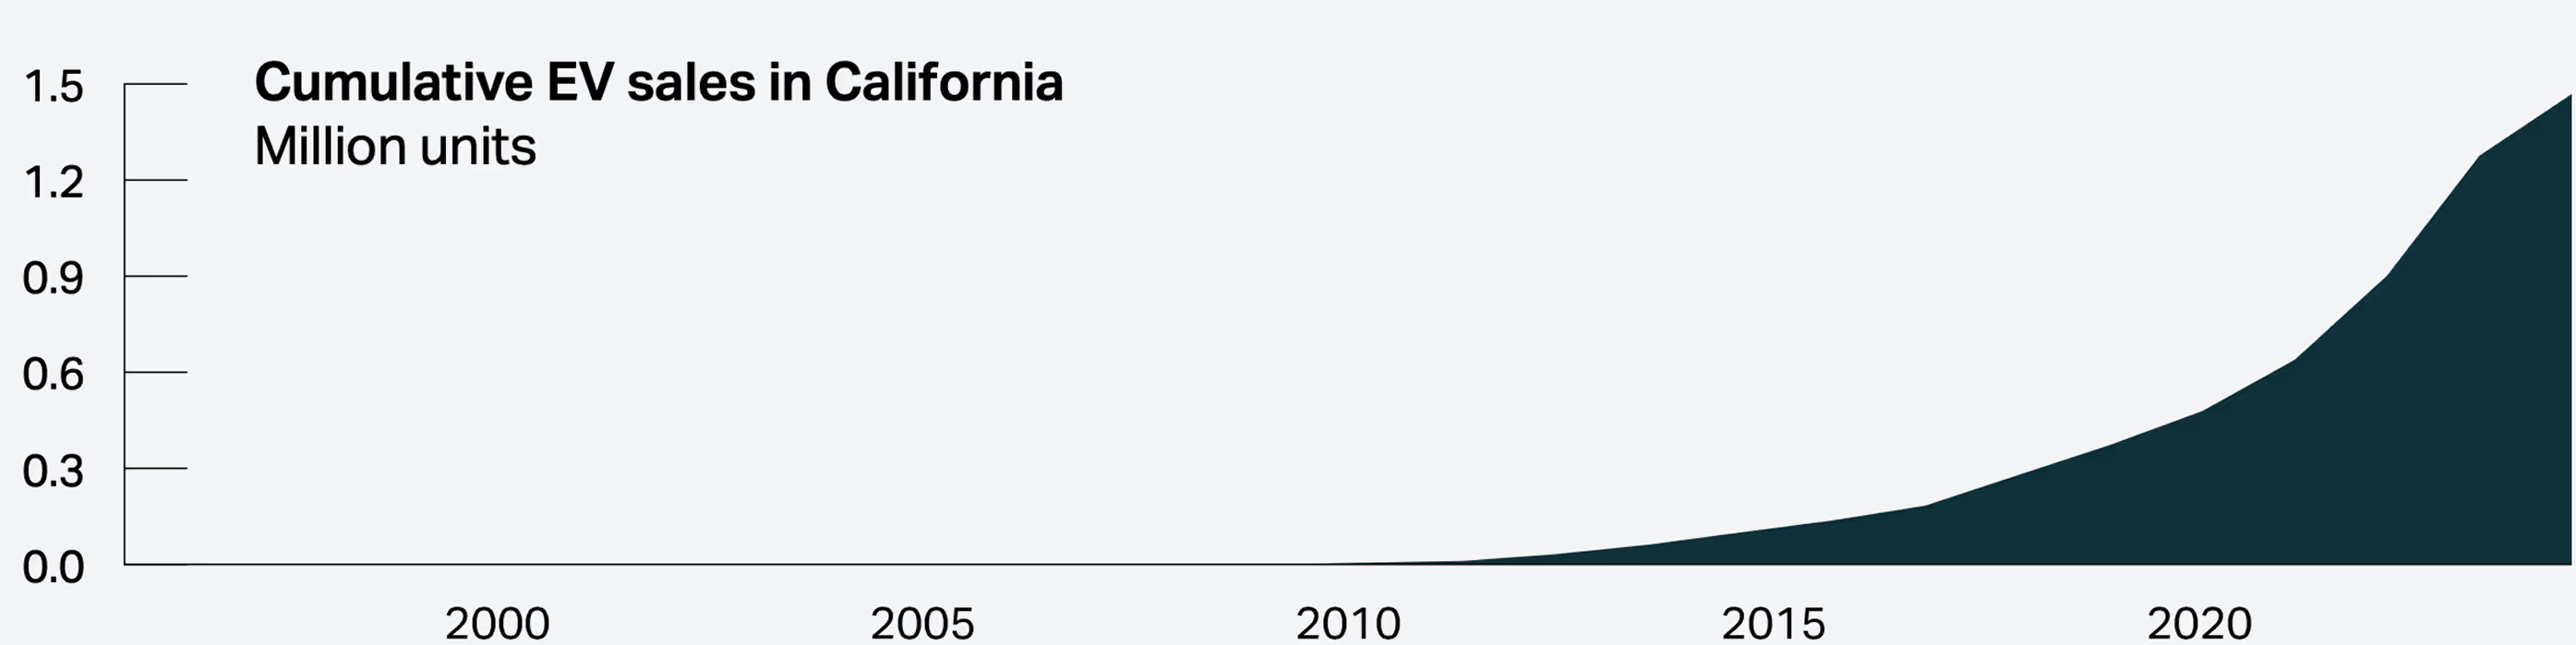
Show footnotesHide footnotes
1: effect size is a statistical indicator on the strength of a relationship between the policy and significant emission reductions
Sources: Stechemesser A, Koch N, Mark E, Dilger E, Klösel P, Menicacci L, Nachtigall D, Pretis F, Ritte, N, Schwarz M, Vossen H & Wenzel A. (2024) Climate policies that achieved major emission reductions: global evidence from two decades. Meckling, Jonas & Sterner,Thomas & Wagner, Gernot (2017). Policy sequencing toward decarbonisation, Columbia Center on Global Energy Policy (2024: Triggering Investment in First of a kind and early near zero emissions industrial facilities; California Clean Vehicle Rebate Project)
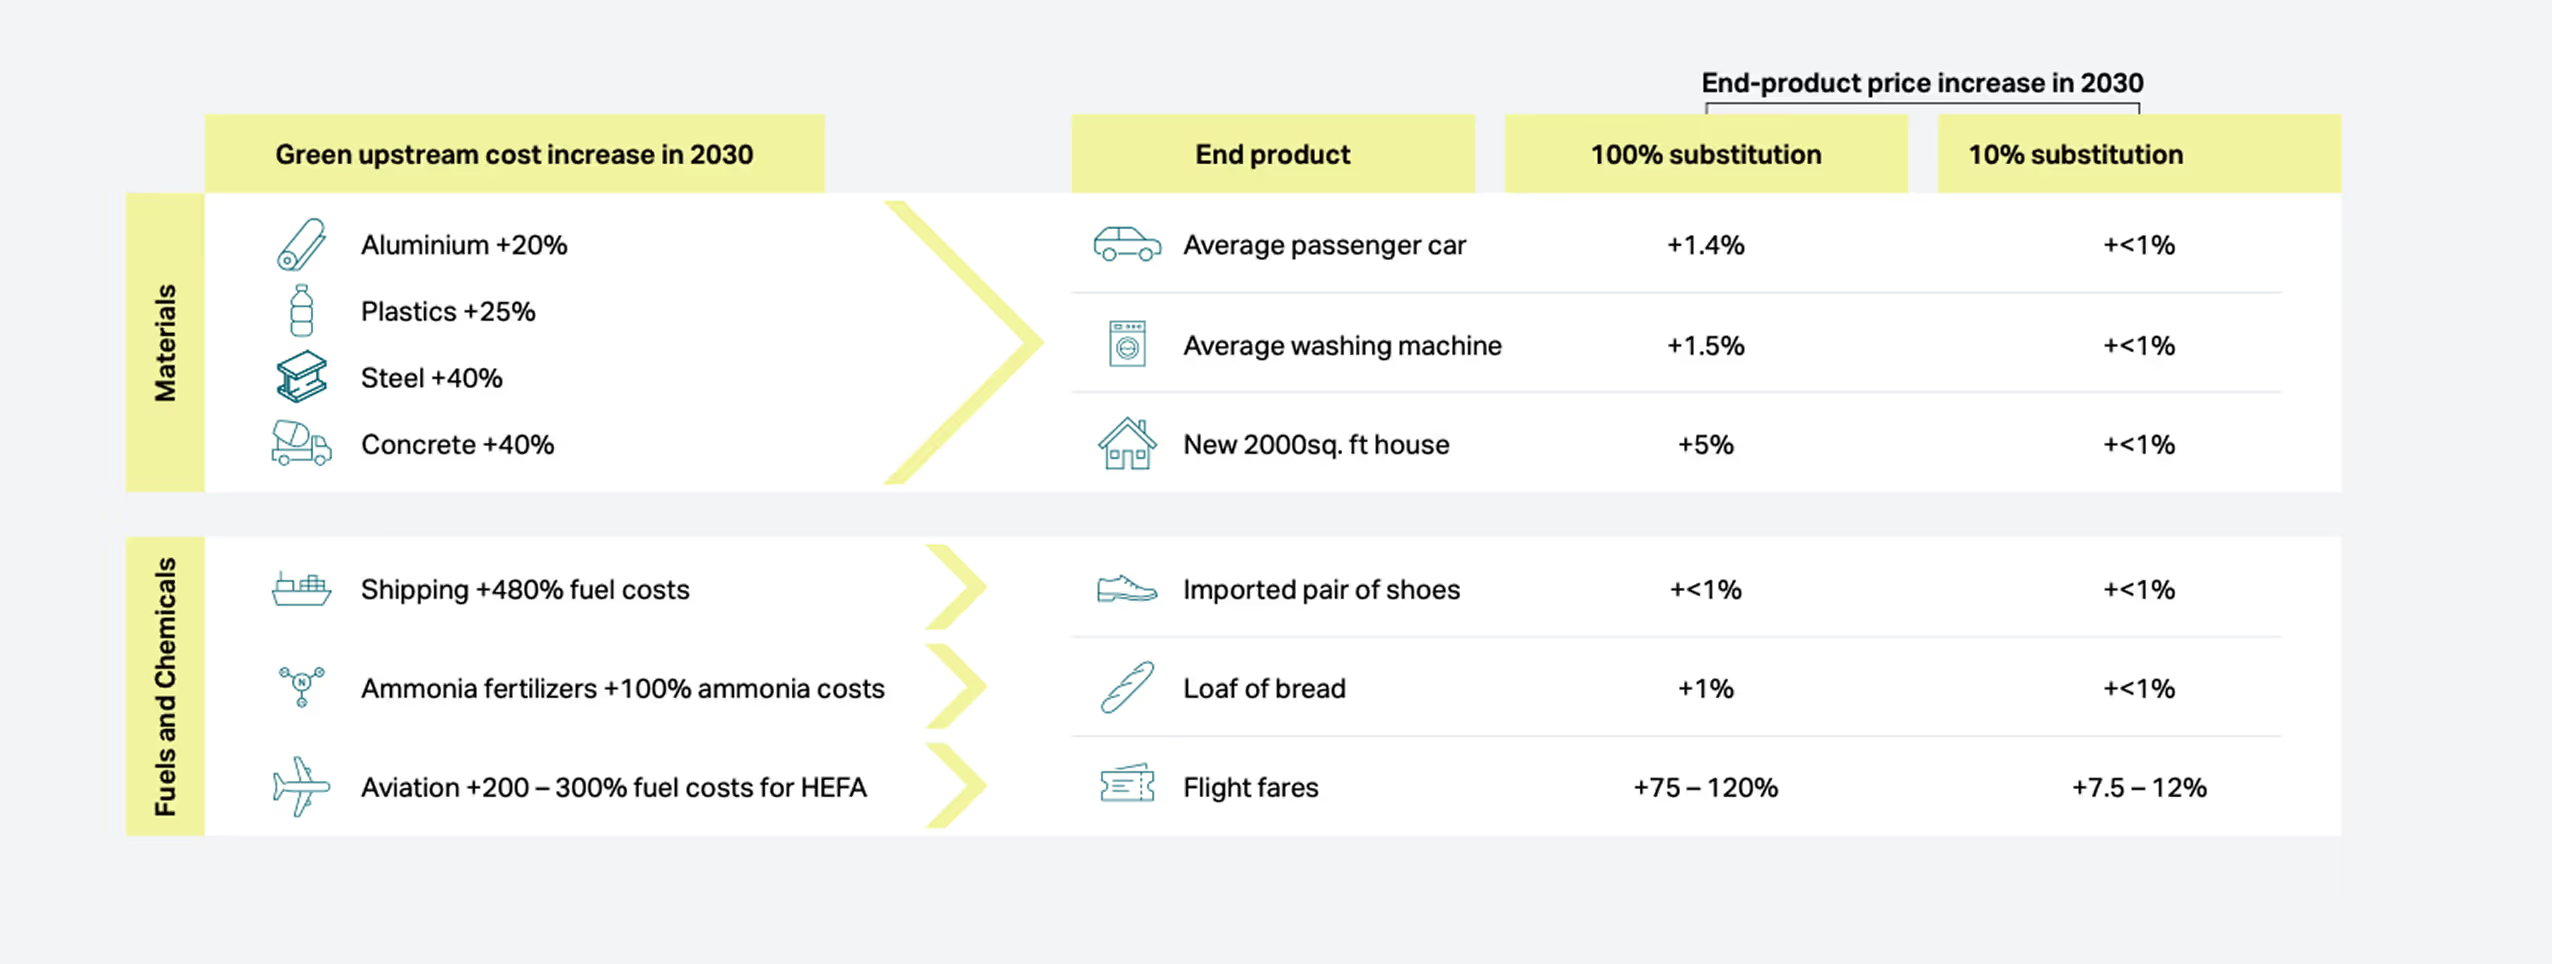
Although it is high at the industrial product level, the green premium in most of these sectors gets diluted throughout the value chain and is manageable at end product or service level.
Show footnotesHide footnotes
Notes on materials: premiums are based on estimates of levelised costs of the relevant commodity per production technology without carbon pricing, weighted by the market share of green versus. fossil-based technologies in 2030 to reach net zero by 2050. Upstream premiums are approximations rounded to the nearest 5%. An average car is assumed to weigh 1860kg and to contain approximately 900kg steel, 180kg aluminium and 180kg plastic. An average washing machine is assumed to weigh 70kg and to contain approximately 30kg steel, 3kg aluminium, 4kg plastic and 25kg concrete. A 2000sq ft house is assumed to weigh 124,000kg and to contain 8,000kg steel and require 40,000kg of cement. Notes on fuels and chemicals: SAF assumes fuel makes up 25-30% of a ticket price. Costs are indicative and based on literature estimates.
Sources: World Steel Association , MPP analysis